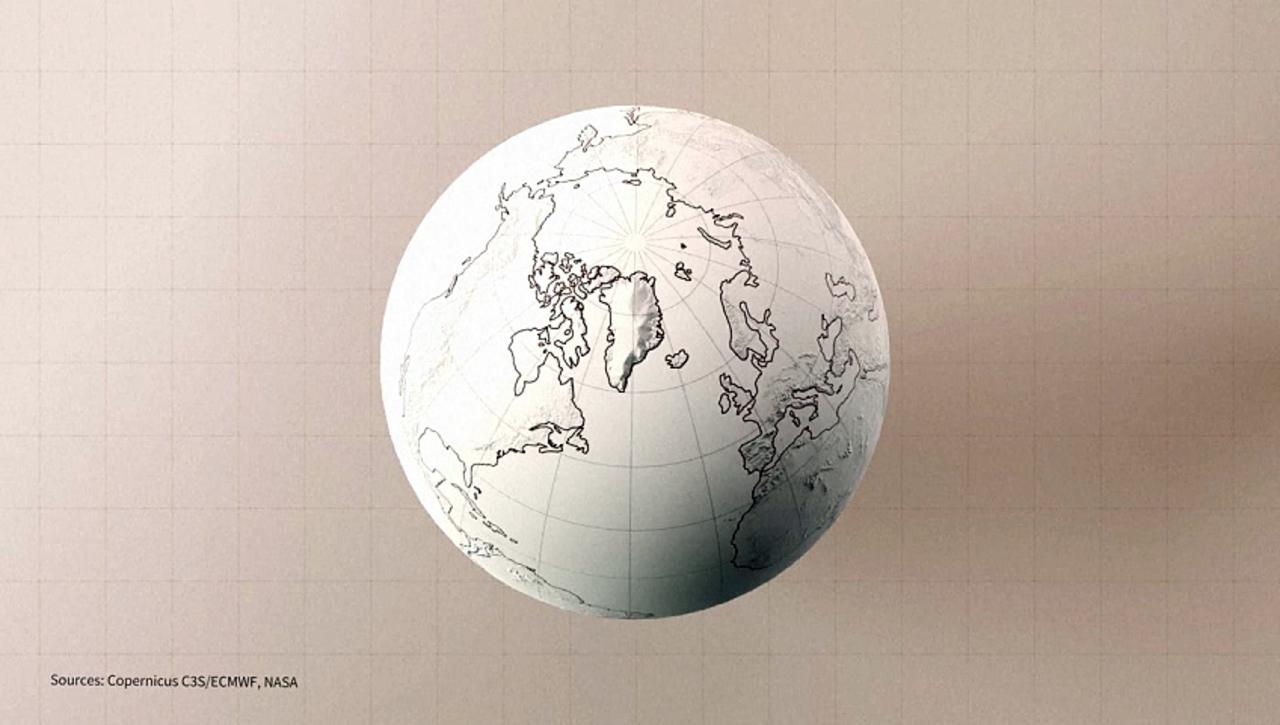
Animated map showing monthly temperature anomalies, from January 1980 to May 2025, focused on the Atlantic ocean and the Northern hemisphere, according to data from the EU climate monitor Copernicus.
VIDEOGRAPHIC
Animated map showing monthly temperature anomalies, from January 1980 to May 2025, focused on the Atlantic ocean and the Northern hemisphere, according to data from the EU climate monitor Copernicus.
VIDEOGRAPHIC